Bangkok Office Building Market Shows Signs of Recovery with Increasing Demand for Green-Certified Buildings - Knight Frank
Contact
Bangkok Office Building Market Shows Signs of Recovery with Increasing Demand for Green-Certified Buildings - Knight Frank
Mr. Panya Jenkitvathanalert, Executive Director and Head of Office Agency, Knight Frank Thailand said that “demand for office space in Q1 2023 continued to show a recovery trend, driven by tenants in the tourism, technology, and consumer products sectors.
Mr. Panya Jenkitvathanalert, Executive Director and Head of Office Agency, Knight Frank Thailand said that “demand for office space in Q1 2023 continued to show a recovery trend, driven by tenants in the tourism, technology, and consumer products sectors, We have also observed a shift of small tenants from home offices to office buildings, offering relatively more attractive rents, greater accessibility and a wider range of amenities and retail support.”
Economic Overview
The Thai economy in 2023 is expected to grow by 3.8%, up from last year's figure of 2.6%.
According to the Ministry of Finance, the GDP of Thailand in 2023 is expected to grow by 3.8% Y-o-Y, mainly driven by the boost in tourism. The number of foreign arrivals is forecast to reach 27.5 million, marking an increase of nearly 150% from the year earlier. On the domestic front, as unemployment rates continued to decline with the average household income increasing, private consumption is expected to grow by 3.5% Y-o-Y. In addition, improving business confidence and the lower inflation rate will increase private investment by 3.6% Y-o-Y. However, the global economic conditions of major trading partners are opposing factors that affect the country's external sector. The export value is predicted to be slower this year, expanding by less than 1% Y-o-Y in real terms.
The Headline Inflation rate in Q1 decreased to 2.8%, falling within the 1-3% target range set by the BOT, mainly due to softening energy prices and a high base from the previous year. Despite this decline, overall price levels remained high, and strong domestic consumption from the ongoing economic recovery could put pressure on consumer prices again. As such, the BOT maintained its policy normalization stance by gradually raising the interest rate to 1.75%, in line with improving economic conditions. At the same time, additional policies, such as SME loan facilities, would be extended as the recovery has been unequal, with smaller firms facing higher debt burdens.
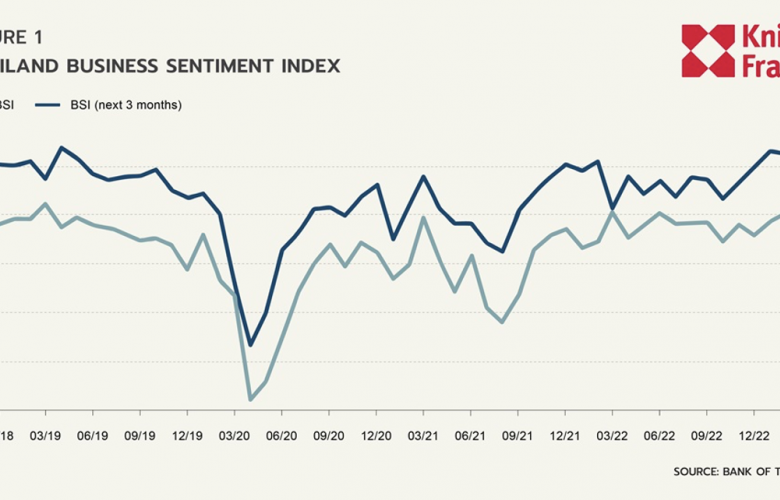
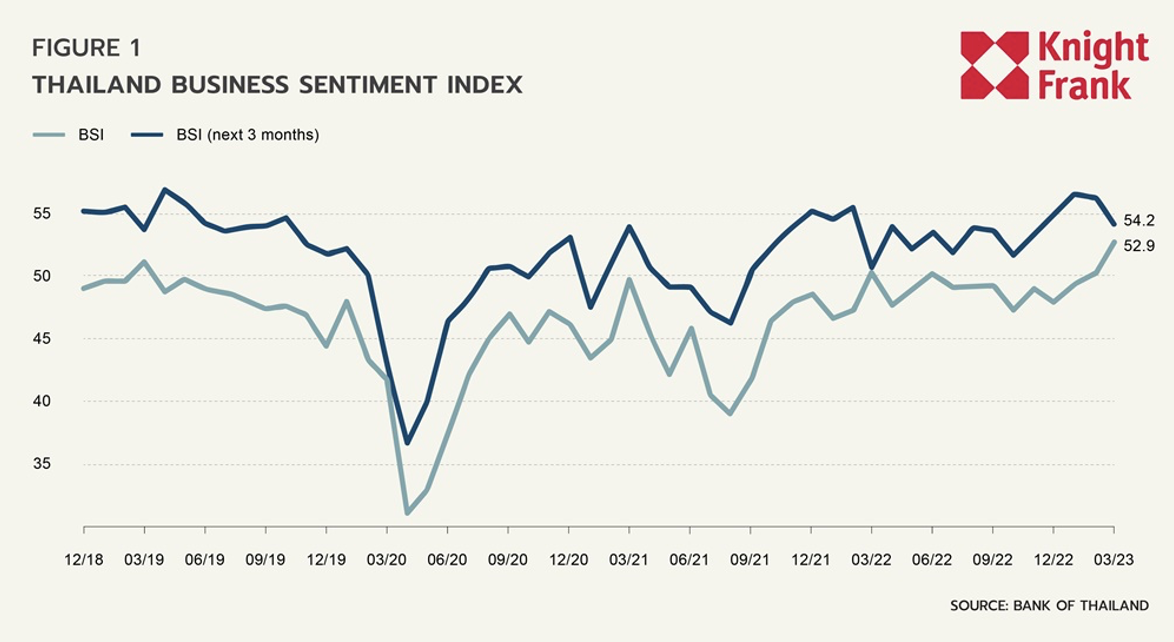
The Business Sentiment Index (BSI) increased to 52.9 from 48.4 in the previous quarter, as reflected in the better firm performance and slower rise in production costs in Q1. However, there have been more concerns about the economic conditions of major trading partners from the respondents. This subdued global demand could limit new production and exports, resulting in less positive expectations for the next three months.
Supply
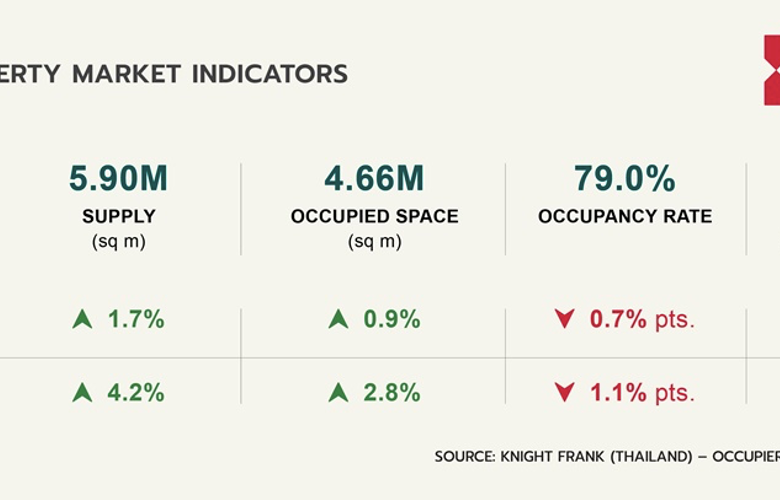
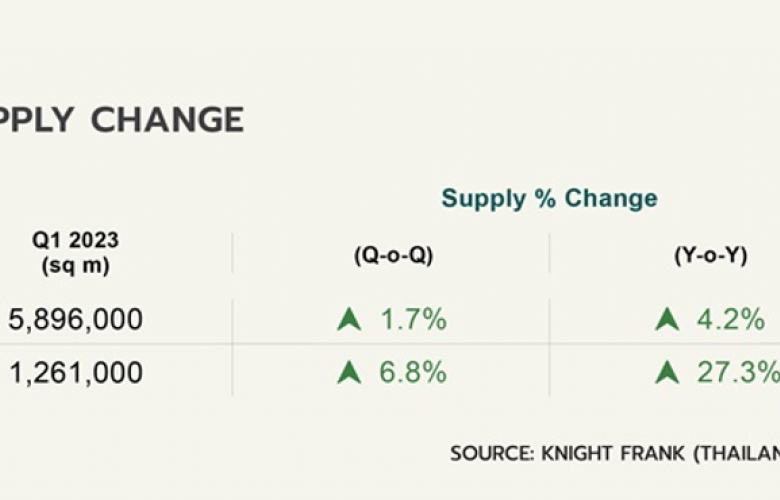
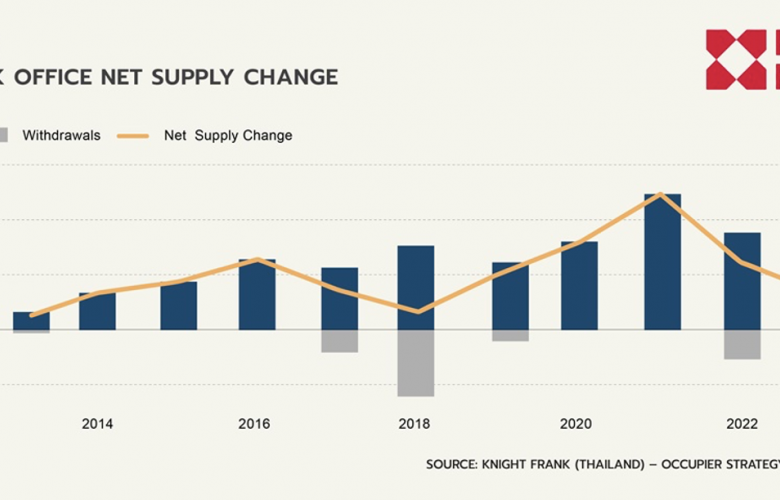
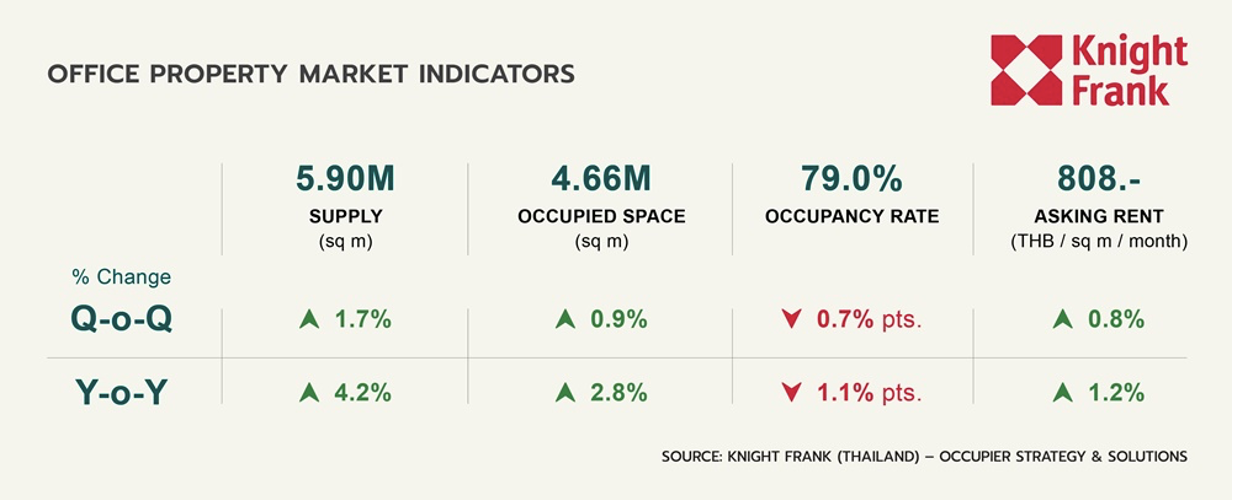
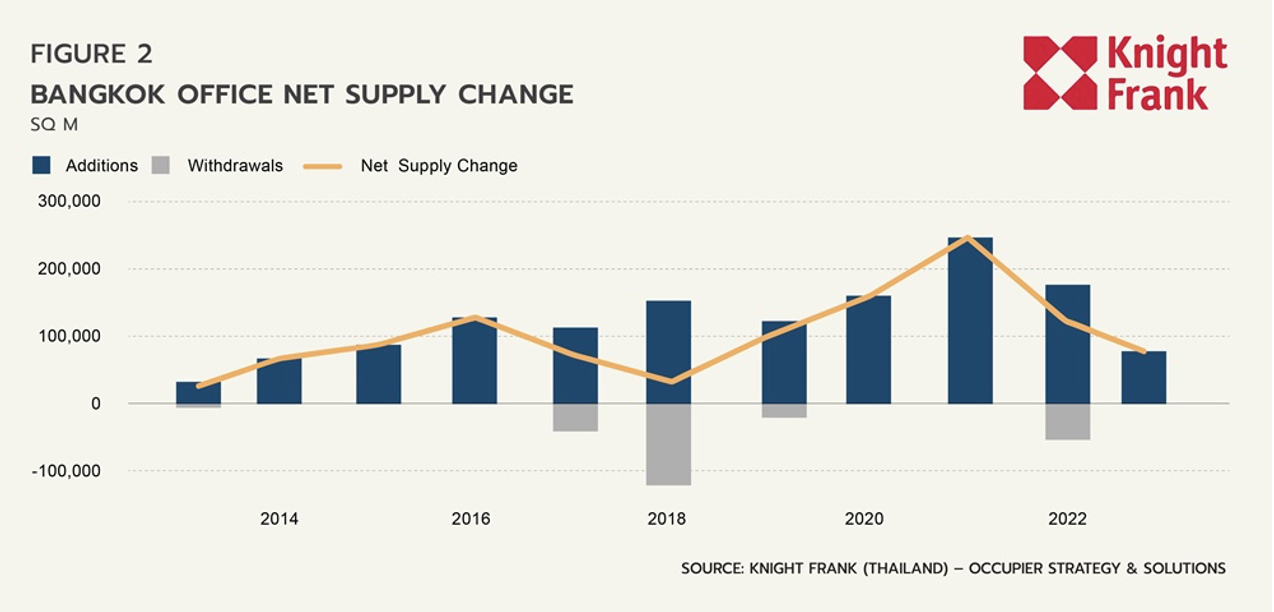
Bangkok's total supply of office space this quarter expanded by 86,000 sq m or +1.7% Q-o-Q. Two new buildings were launched in Q1, including One City Centre on Ploenchit Road, opposite to Central Embassy, and The Rice at the corner of the Saphan Kwai intersection. In addition to this, we witnessed the new supply from Summer Lasalle, which announced a new development inside their existing project. As most of the newly completed buildings were green-certified, the total lettable area of green office space increased by 7.3% Q-o-Q to 1,261,000 sq m, making up 21% of the total market.

Future Supply
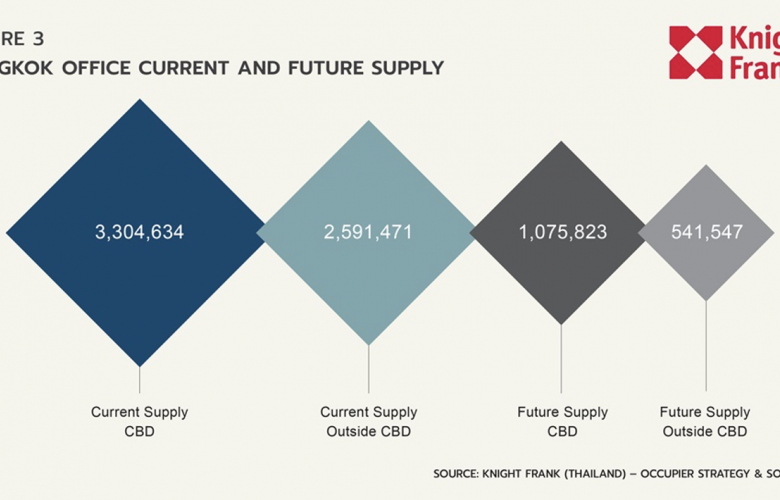
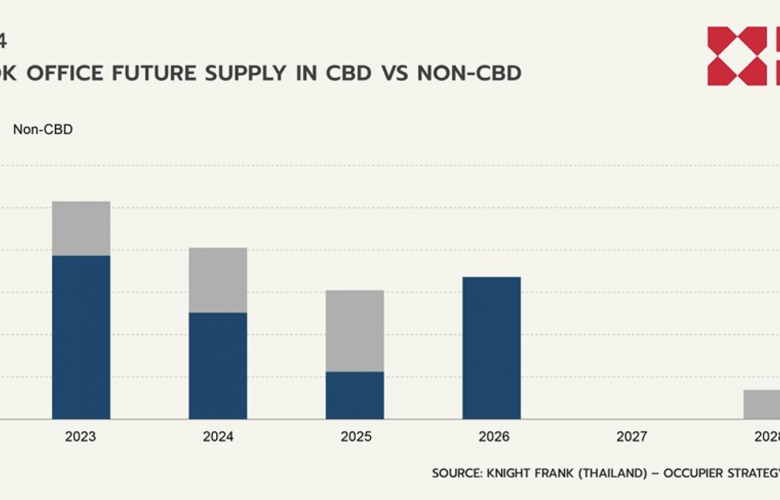
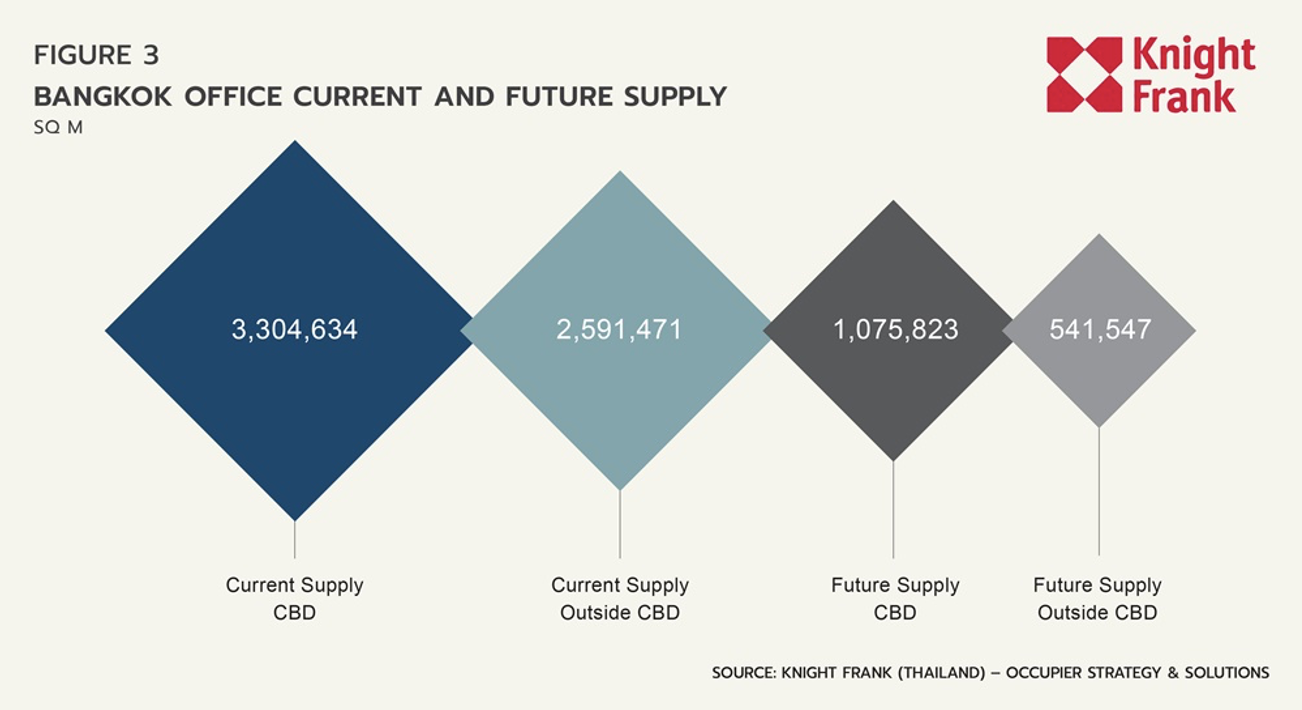
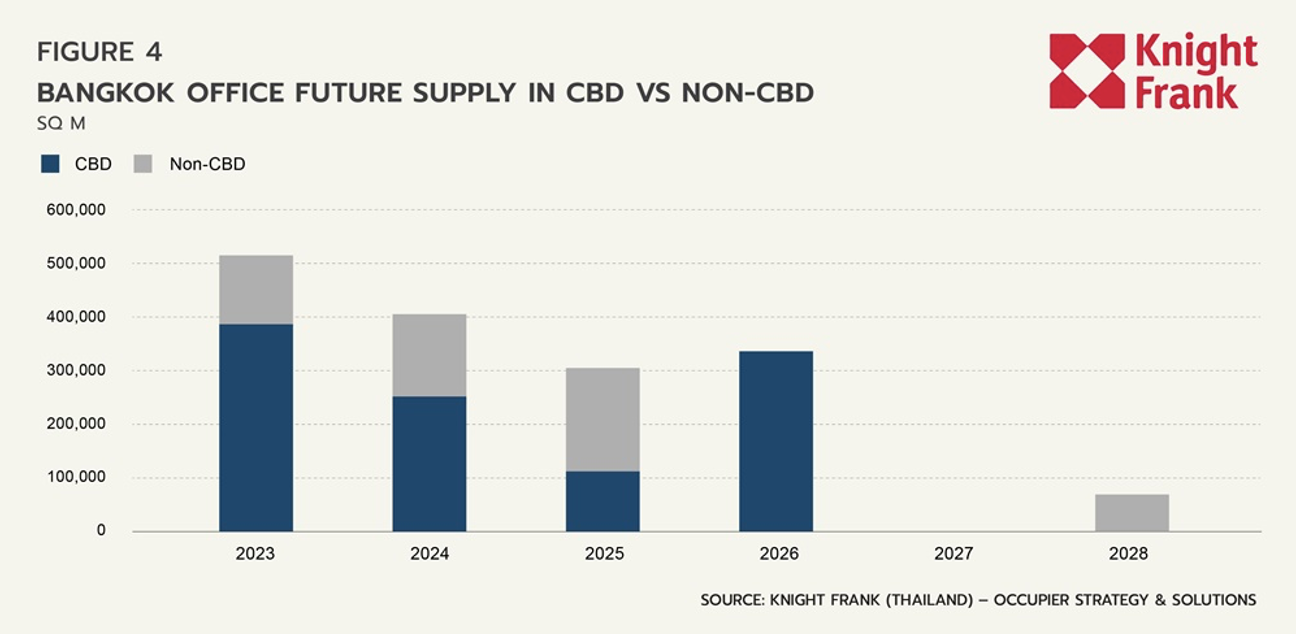
Two new projects outside CBD have gone public this quarter: Cloud 11 by MQDC in Upper Sukhumvit and a low-rise office and retail project by Property Perfect Group on Ratchadapisek Road. The upcoming supply at the end of 2023 - 2025 is expected to be 509,000, 402,000, and 302,000 sq m, respectively. The total size of the future lettable area totalled 1.62 million sq m, accounting for 27% of the current level of office supply. 67% of the supply in the pipeline is in the CBD.
Demand
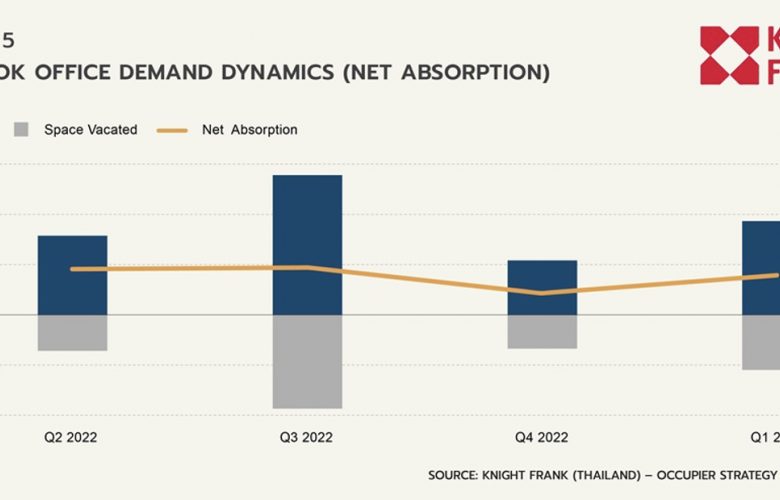
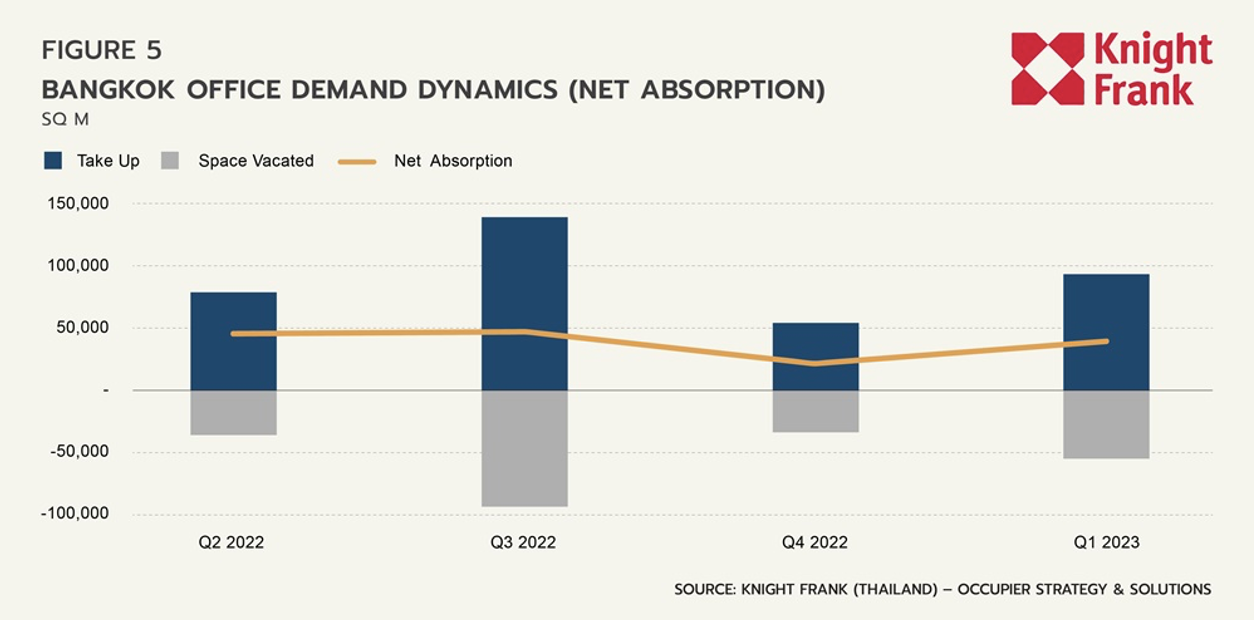
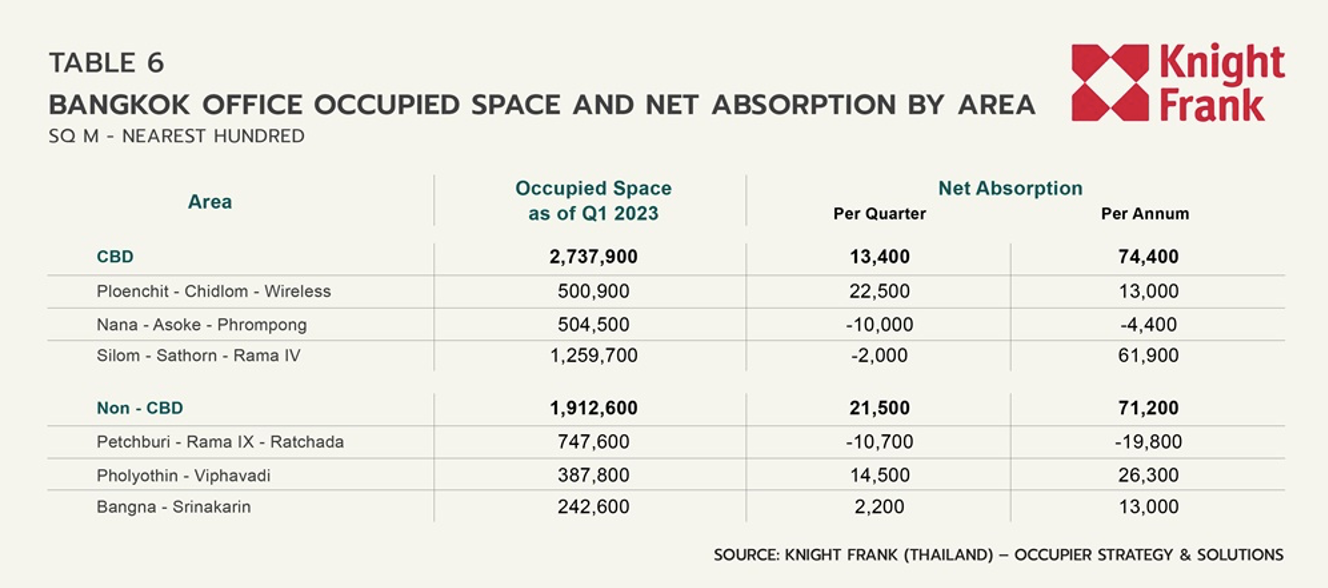
The market net absorption increased to 39,500 sq m in Q1 2023 from 20,900 sq m in Q4 2022. Over the past year, the market's net absorption tallied 150,700 sq m, passing the 10-year average of 78,400 sq m. This above-average net absorption figure indicated that the demand recovery gained momentum.
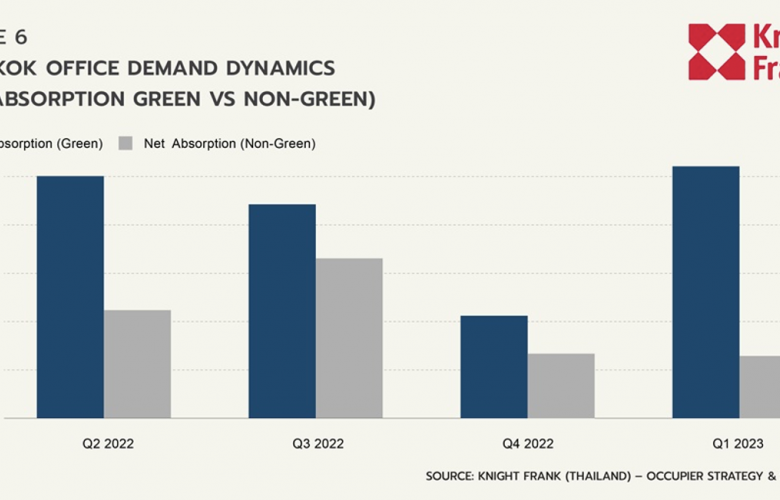
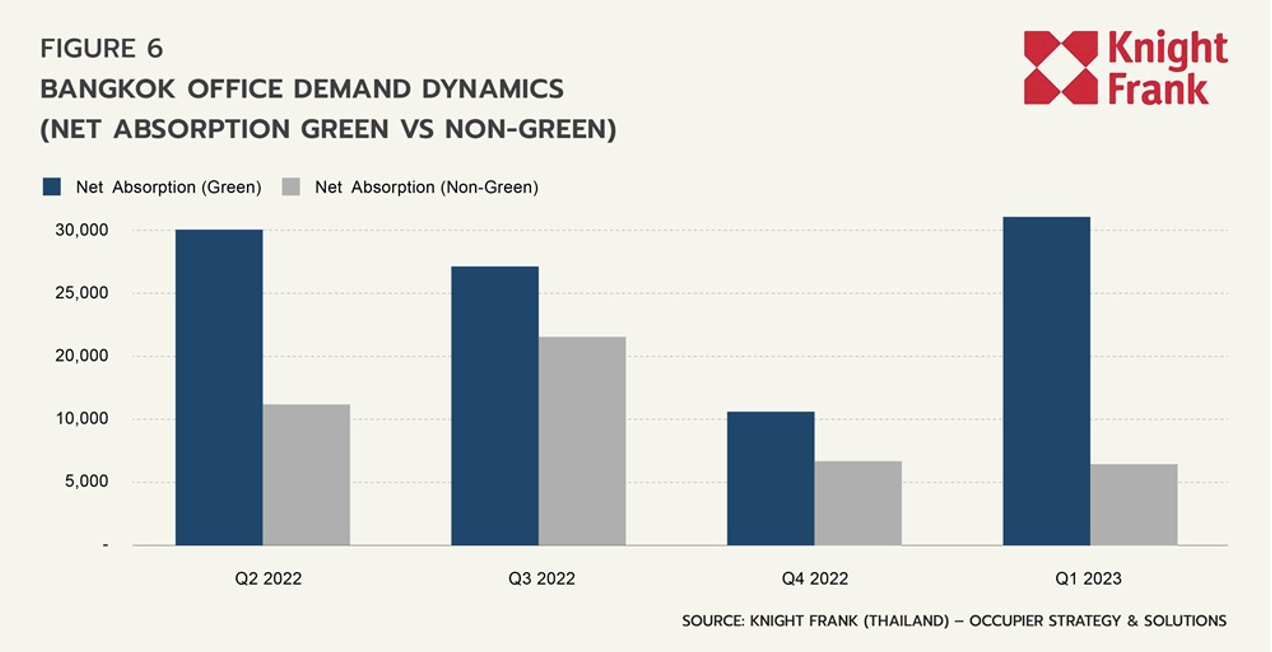
Regarding the ESG aspect, green buildings had a net absorption of 31,600 sq m, which remained higher than non-green buildings at 7,900 sq m. In terms of location, the size of leasing activities in Q1 was similar for inside and outside CBD. However, more new demand was observed outside the CBD, resulting in higher net absorption at 26,000 sq m compared to 13,500 sq m within the CBD.
Market Dynamics by Segment
Despite recording the highest net absorption, Grade A offices experienced the biggest decline in occupancies in Q1.
The total occupied space increased by 39,500 sq m to 4.65 million sq m in Q1 2023, with all grades recording positive net absorption. Grade A showed the most significant increase in occupied space with a quarterly net absorption of 23,900 sq m due to the decent take-up in a recently completed building. Meanwhile, net absorption of grade B slowed this quarter. Still, it remained the most popular segment over the past year, with net absorption of 78,200 sq m per annum.
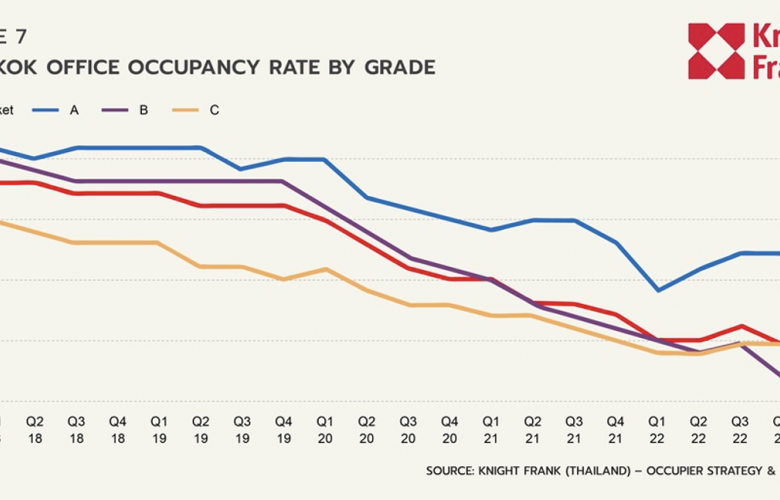
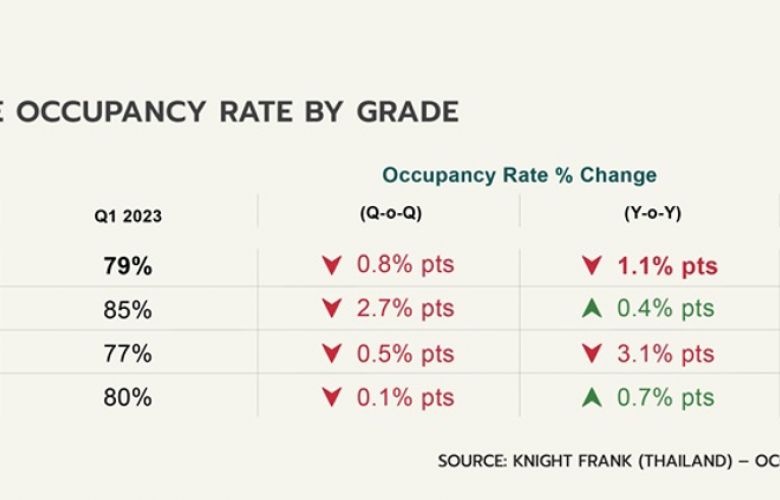
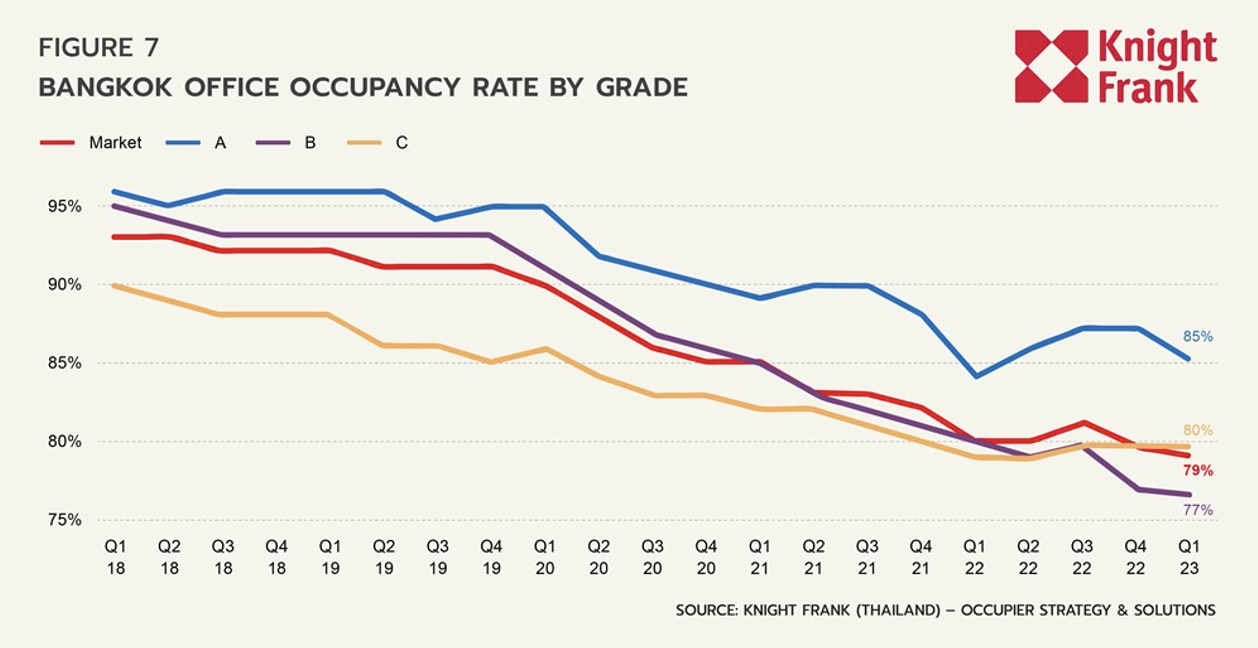
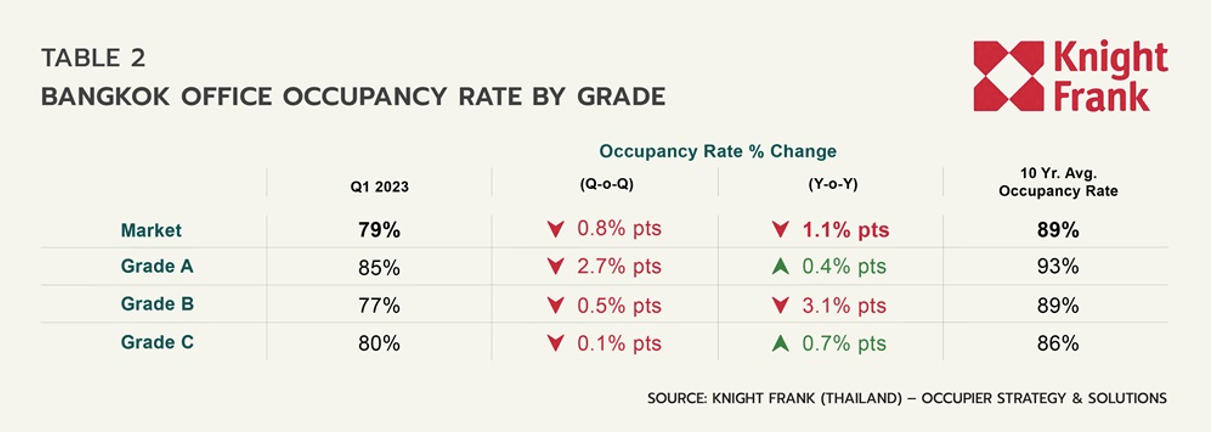
The overall market occupancies fell by -0.8% pts Q-o-Q to 79%, with a downward trend in all segments. The occupancy rate of Grade A reduced by 2.7% pts Q-o-Q to 85% due to the pressure from new supply, which outpaced demand. The occupancy rate of Grade B declined slightly Q-o-Q, but in the past year, it fell by more than 3% Y-o-Y, despite having the highest demand compared to other grades. Meanwhile, the occupancy rate of Grade C remained steady at around 80%, with minimal changes in the performance Q-o-Q and Y-o-Y.
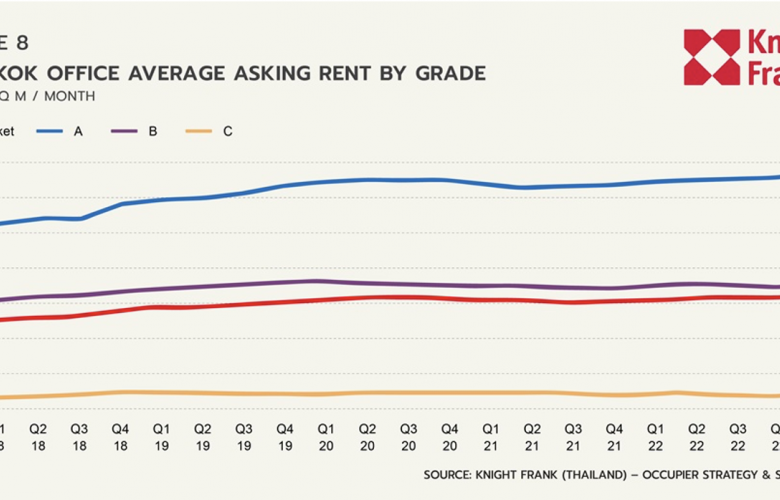
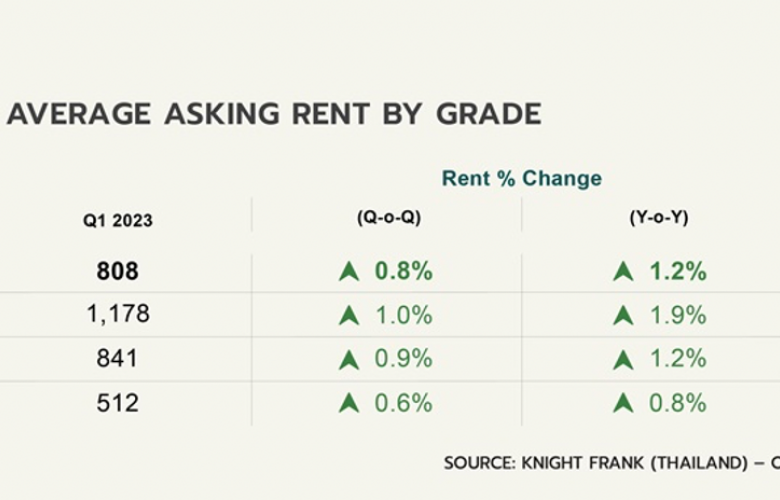
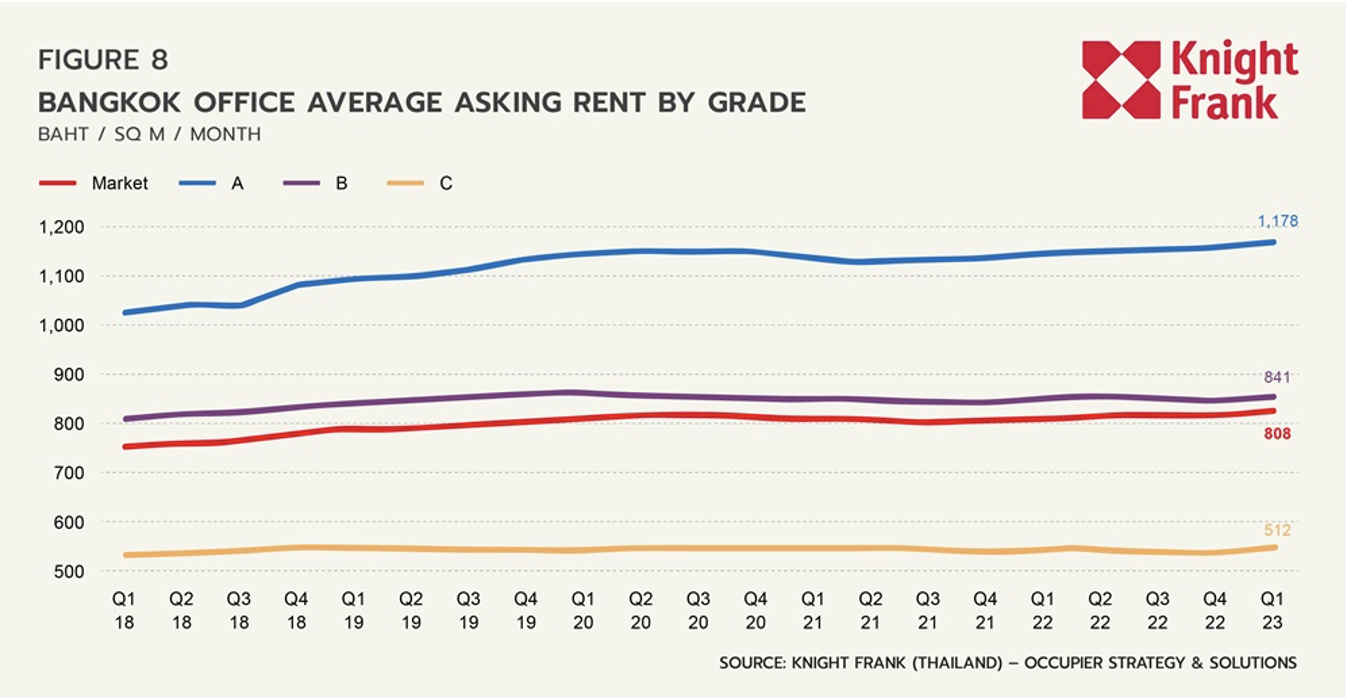
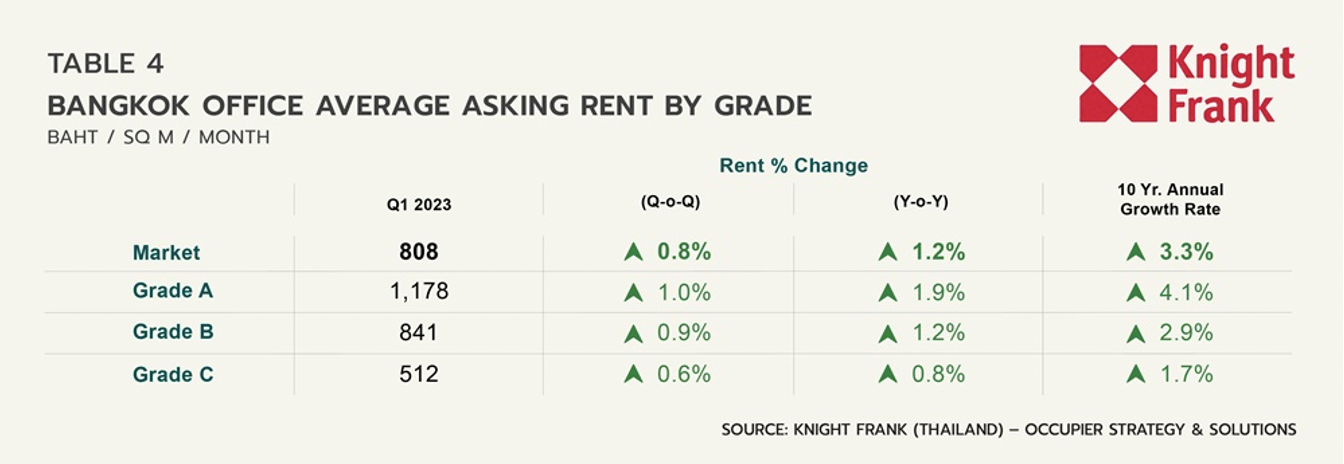
In Q1, the average market rent increased to THB 808 per sq m per month, with all grades experiencing rental growth. Despite the rapid increase in total supply, many landlords raised rents after maintaining flat rates for the past few years. Grade A witnessed the most substantial rental increase, rising by 1% Q-o-Q to THB 1,178, thanks to its relatively high occupancy and the contribution of new supply to the average rent growth. Meanwhile, Grade B and C experienced smaller rental growth, with increases of 0.9% Q-o-Q to THB 841 and 0.6% Q-o-Q to THB 512, respectively.
Market Dynamics by Area
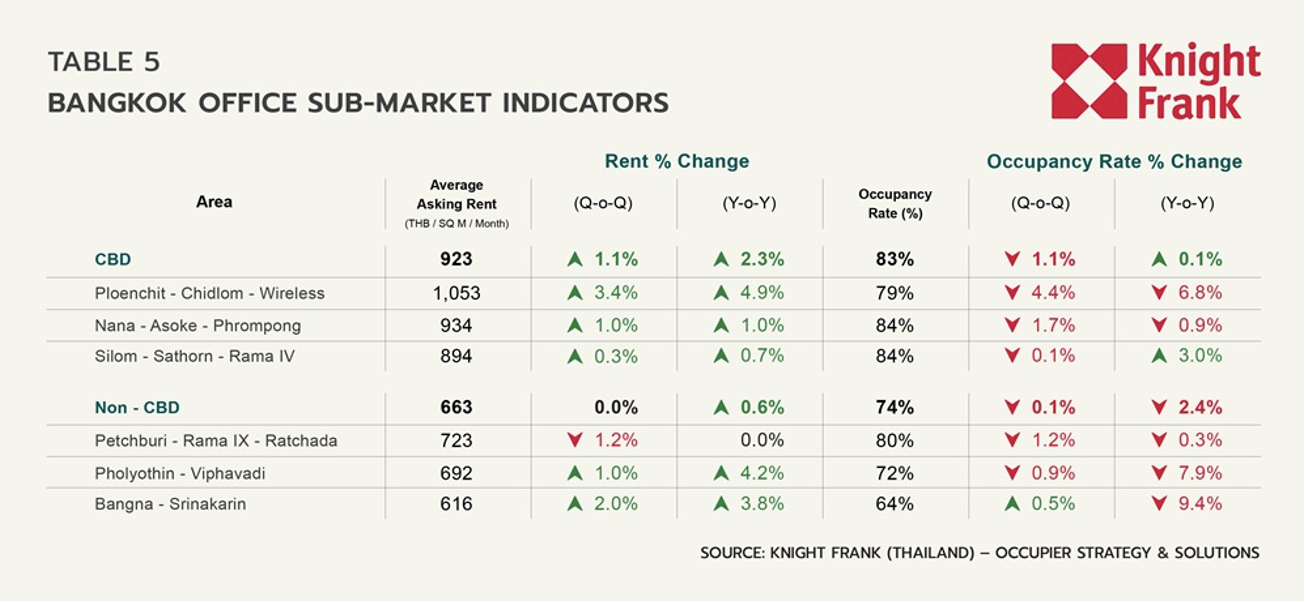
The occupancy rates in most sub-markets were set to decline, while the average asking rent resumed an upward trend.
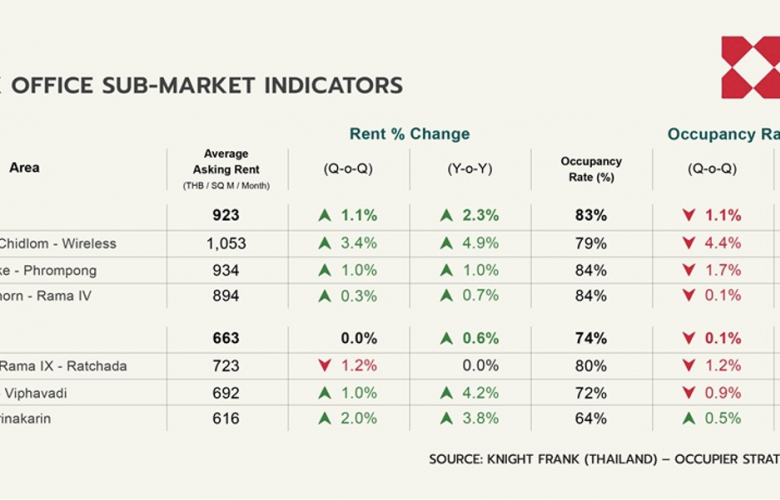
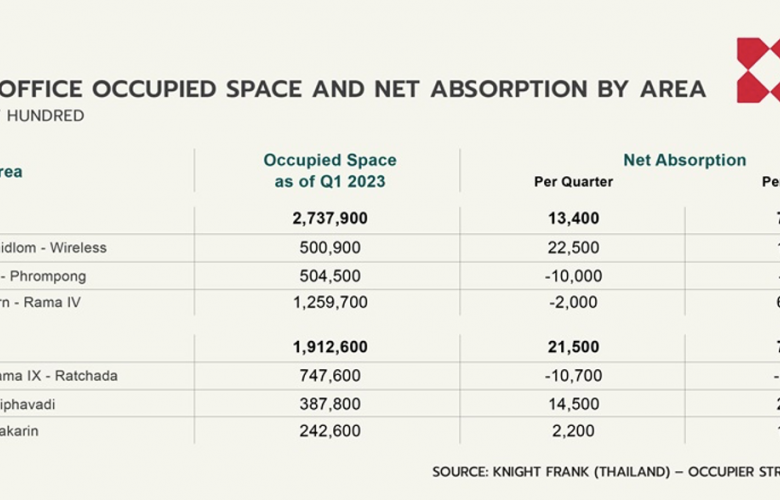
The average asking rent of CBD properties rose to 922 THB per sq m per month, with the average occupancy rate dropping to 83%. All major sub-market in CBD experienced positive rental growth, led by Ploenchit – Chidlom – Wireless, which saw a considerable increase of 4.9% Y-o-Y, yet suffering from an occupancy rate tumbling by nearly 7% Y-o-Y. Silom - Sathorn - Rama IV demonstrated the best performance overall, with rental growth by 0.6% Y-o-Y and an occupancy rate increase of 3% Y-o-Y. The strong performance of this sub-market is in line with net absorption figures, with over 60,000 sq m over the past year.
The average asking rent for office space outside CBD remained stable at 662 THB per sq m per month, while an occupancy rate tumbled by 2.6% pts Q-o-Q to 74%. All major sub-market saw higher rental growth, except Petchburi - Rama IX – Ratchada, which witnessed-1.2% Q-o-Q because some properties adjusted the pricing strategy. Phaholyothin – Viphavadi saw the highest net absorption this quarter outside CBD but still saw an occupancy rate decline of 0.9% Q-o-Q. Finally, Bangna – Srinakarin saw an increase in the average asking rent due to a few existing properties charging a higher rent, with a growth of 2% Q-o-Q. Meanwhile, the occupancy rate of this sub-market improved slightly by 0.5% Q-o-Q after a large amount of new supply had already been added last quarter.
Outlook
In Q1 2023, the demand for office space in Bangkok exhibited a recovery trend similar to that of the Thai economy. Net absorption has remained positive for four consecutive quarters, resulting in 145,000 sq m of office space being absorbed over the past year. However, the increase in new supply, amounting to 86,000 sq m, continued to outpace demand, leading to a decline in the market's occupancy rate to 79% in Q1 2023. In terms of pricing, the average asking rent for office space started to rise again in 2023, growing by 0.9% Q-o-Q or 1.2% Y-o-Y to THB 808 per sq m per month. This rental increase is attributed to both new buildings setting higher rents and existing buildings raising rents after holding steady since the onset of the COVID pandemic.
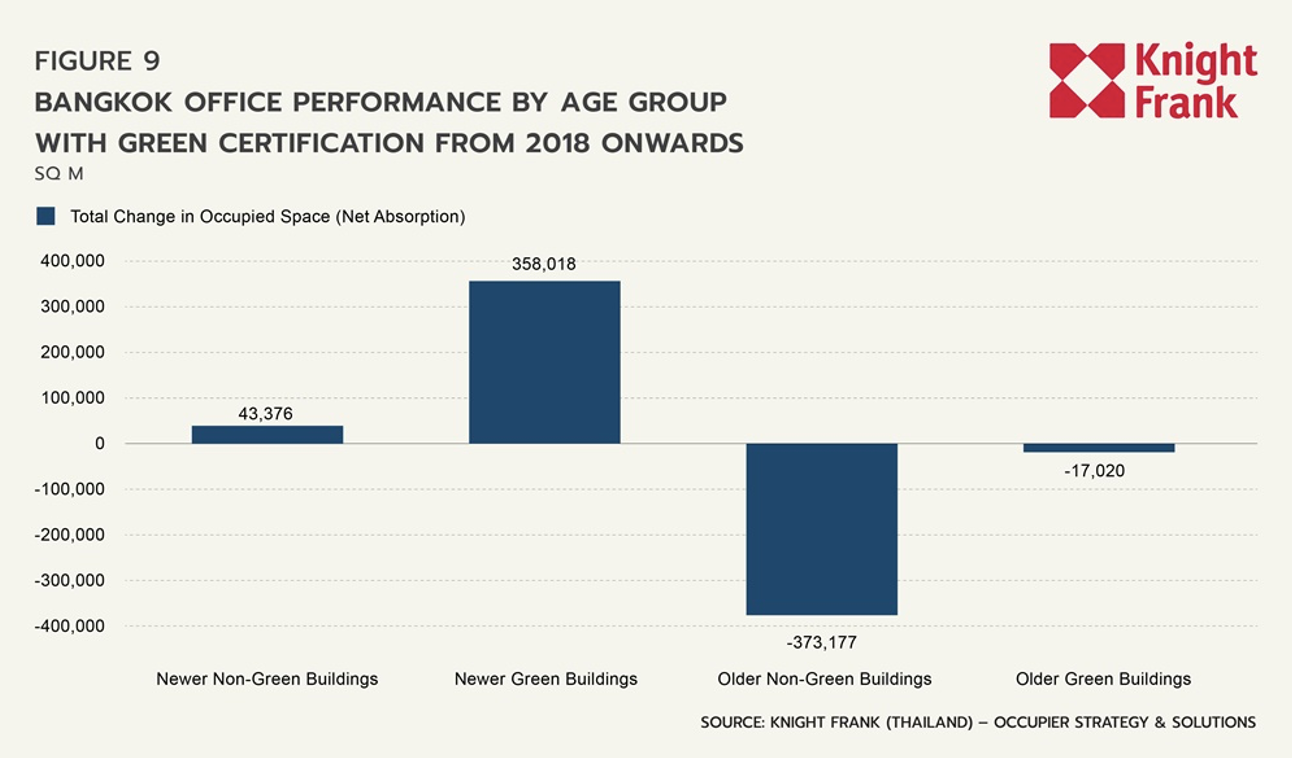
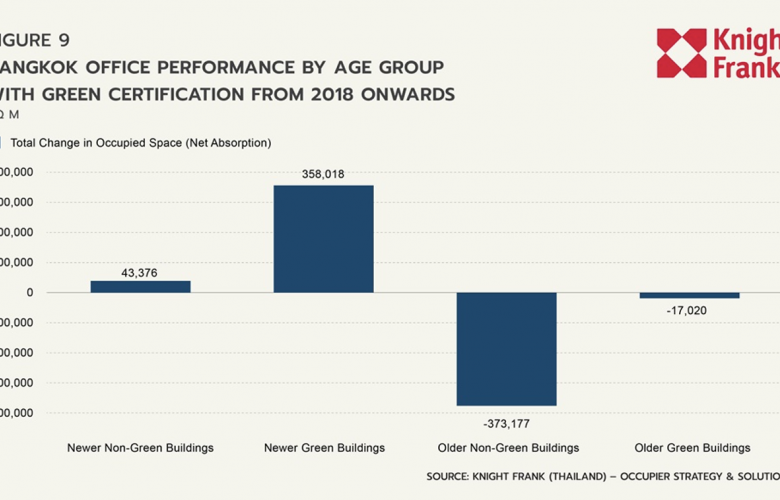
It is widely acknowledged that a lot of new office space will continue to enter the market,potentially posing a threat to existing buildings, particularly the ageing ones. To investigate this matter, Knight Frank conducted a study to examine the performance of all office buildings built before and after the year 2000 over the past five years. It is found that older buildings have lost 390,000 sq m of occupied space while newer buildings secured 401,000 sq m.
In addition, considering the sustainability aspect, we observed that older buildings with green certification, such as LEED and WELL, only lost 17,000 sq m of occupied space compared to a significant loss of 373,000 sq m in older buildings without green certification. The results were consistent for buildings completed after 2000, as those newer buildings with green certification recorded an increase of 358,000 sq m in occupied space, while newer buildings without green certification only gained 43,000 sq m.
This finding highlights the differences between the performance of older and newer buildings and the importance of upgrading facilities to meet ESG standards. Buildings that take proactive measures to adapt and align with these standards are more successful in securing tenancy than those that do not. Moreover, it is evident that older buildings that implement substantial improvements to their facilities can remain competitive in the market.
